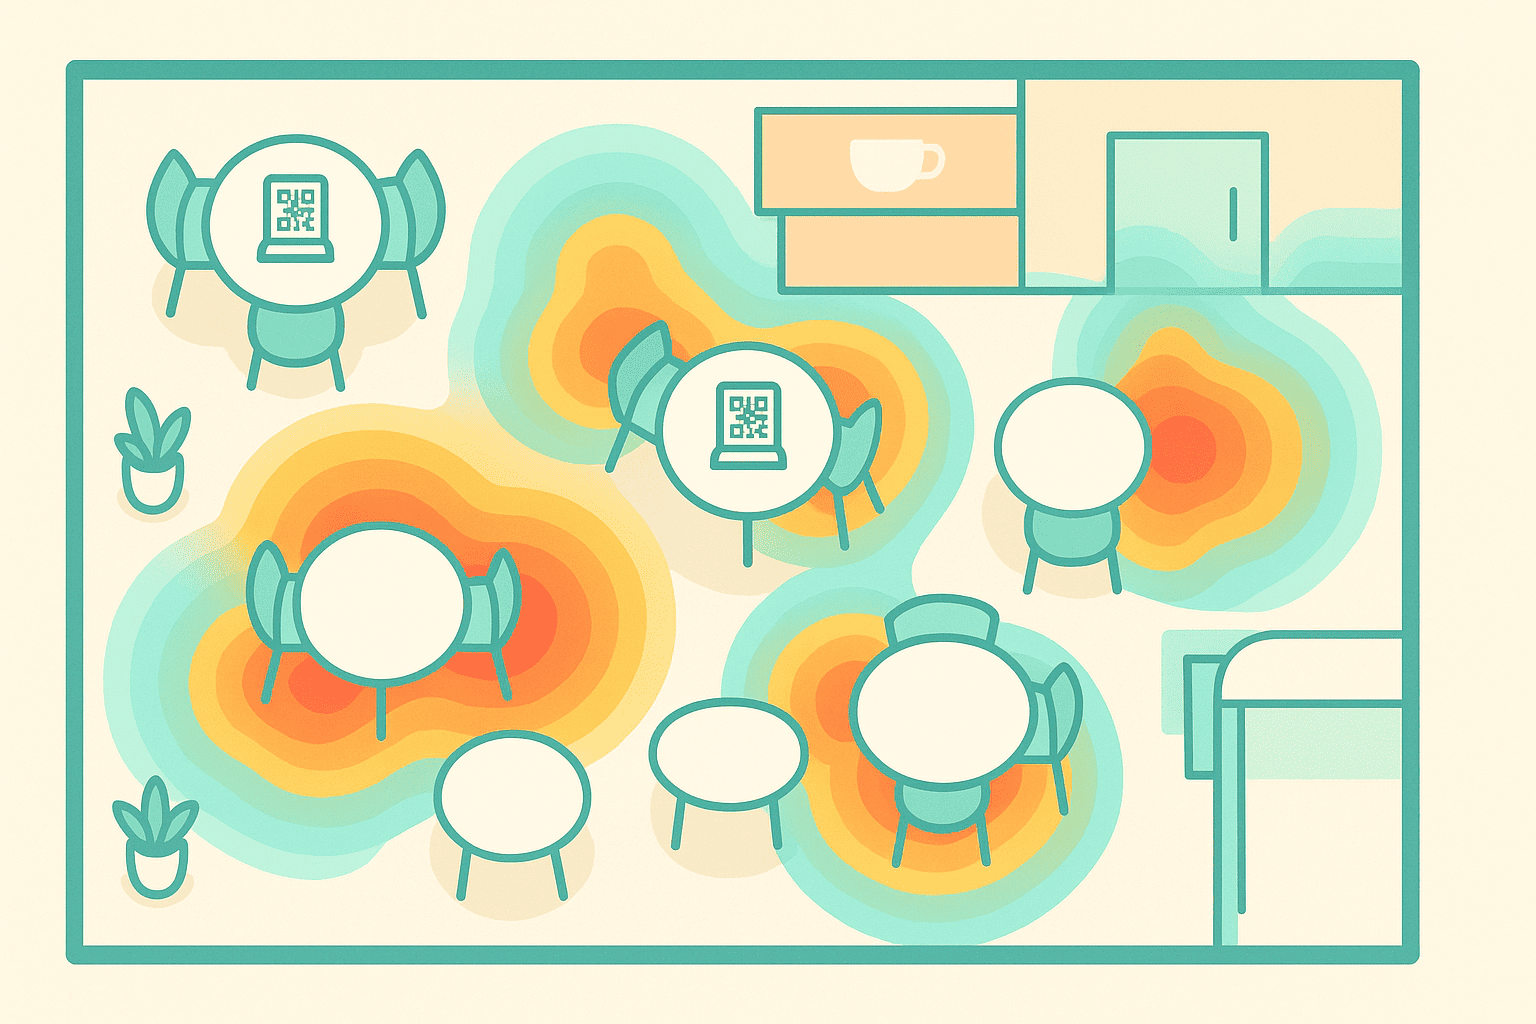
A heatmap is widely used in website marketing to visualize user behavior, such as the areas that receive the most clicks. Dynamic QR code technology brings the same idea into physical spaces through the QR Scanning Heatmap, a spatial analytics tool for F&B and retail businesses.
Rather than presenting raw numbers alone, a QR Scanning Heatmap turns scan data into a visual view of a restaurant or store floor plan. Managers can quickly identify hotspots and coldspots, creating a clearer basis for refining layouts, QR code menu placement, and in-store point-of-sale marketing.
1. How a QR Scanning Heatmap Works
An accurate heatmap combines several types of data collected through a Dynamic QR Code system.
1.1. Collecting Location Data
- IP-based geolocation data: Each QR code scan records an IP address, which can be used to estimate the scanner's location, such as their city or area.
- Optional GPS data: With the user's permission, the system can access more precise GPS coordinates, often accurate to within a few meters.
1.2. Assigning QR Codes to Specific Locations
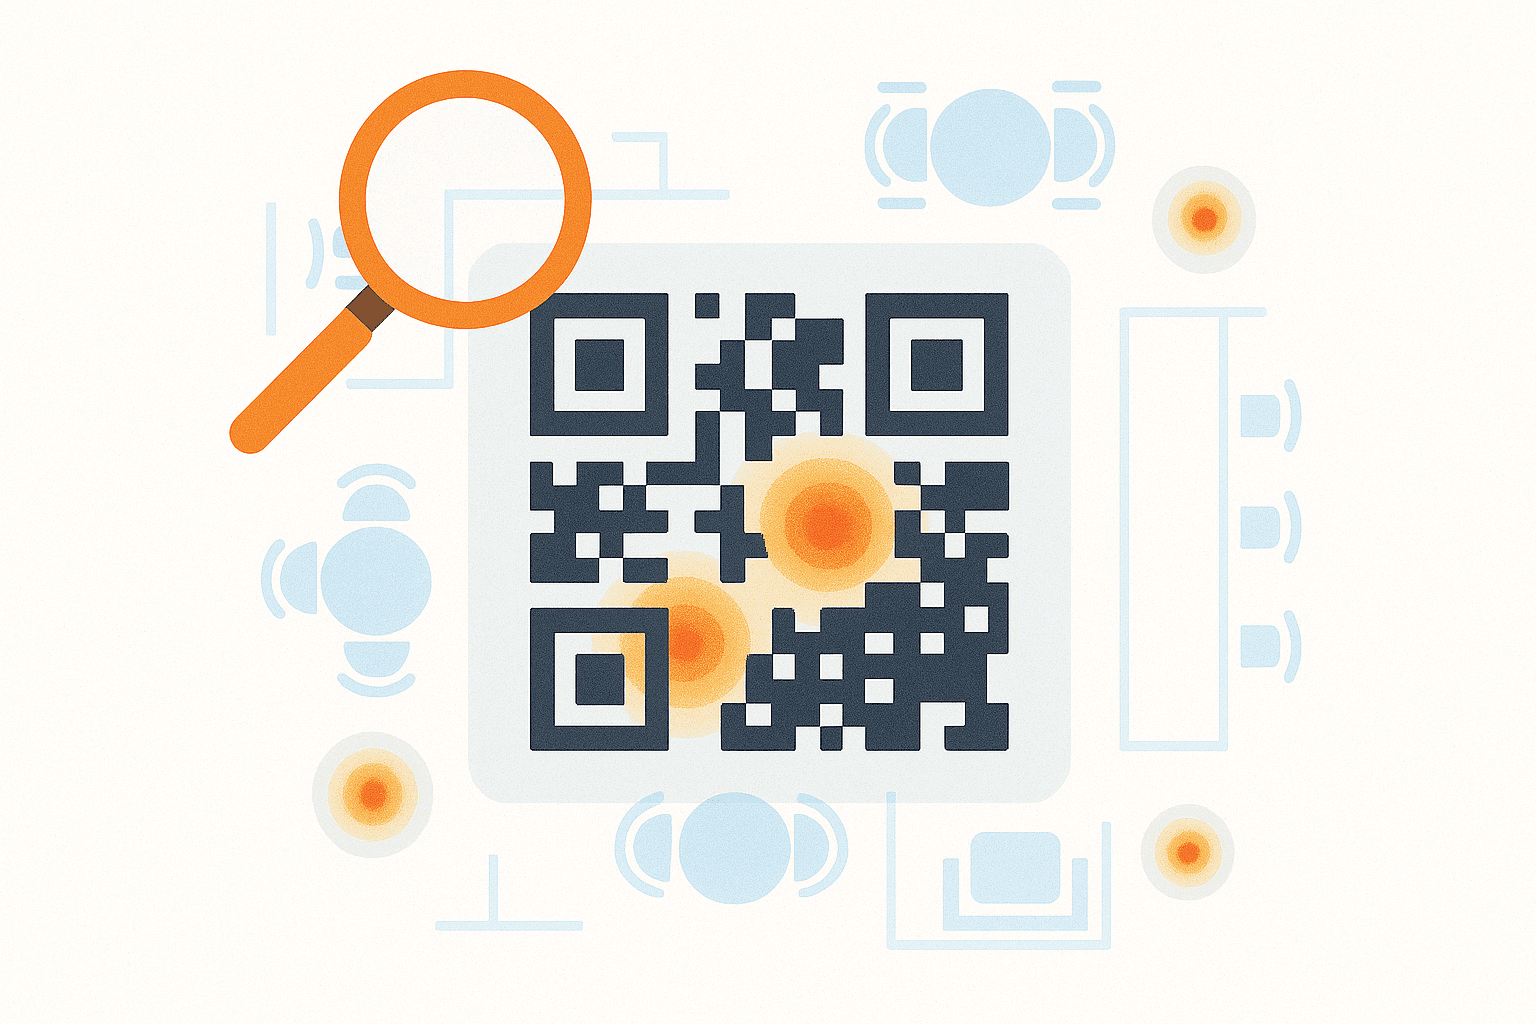
Restaurants can place multiple dynamic QR codes, with each code assigned to a specific location—for example, QR Code A at Table 5, QR Code B at the bar counter, and QR Code C in the waiting area. By comparing the scan volume and timing for each code, the system can map interaction activity across the venue.
1.3. Displaying Data on a Floor Plan
The collected data is mapped directly onto the restaurant's actual floor plan.
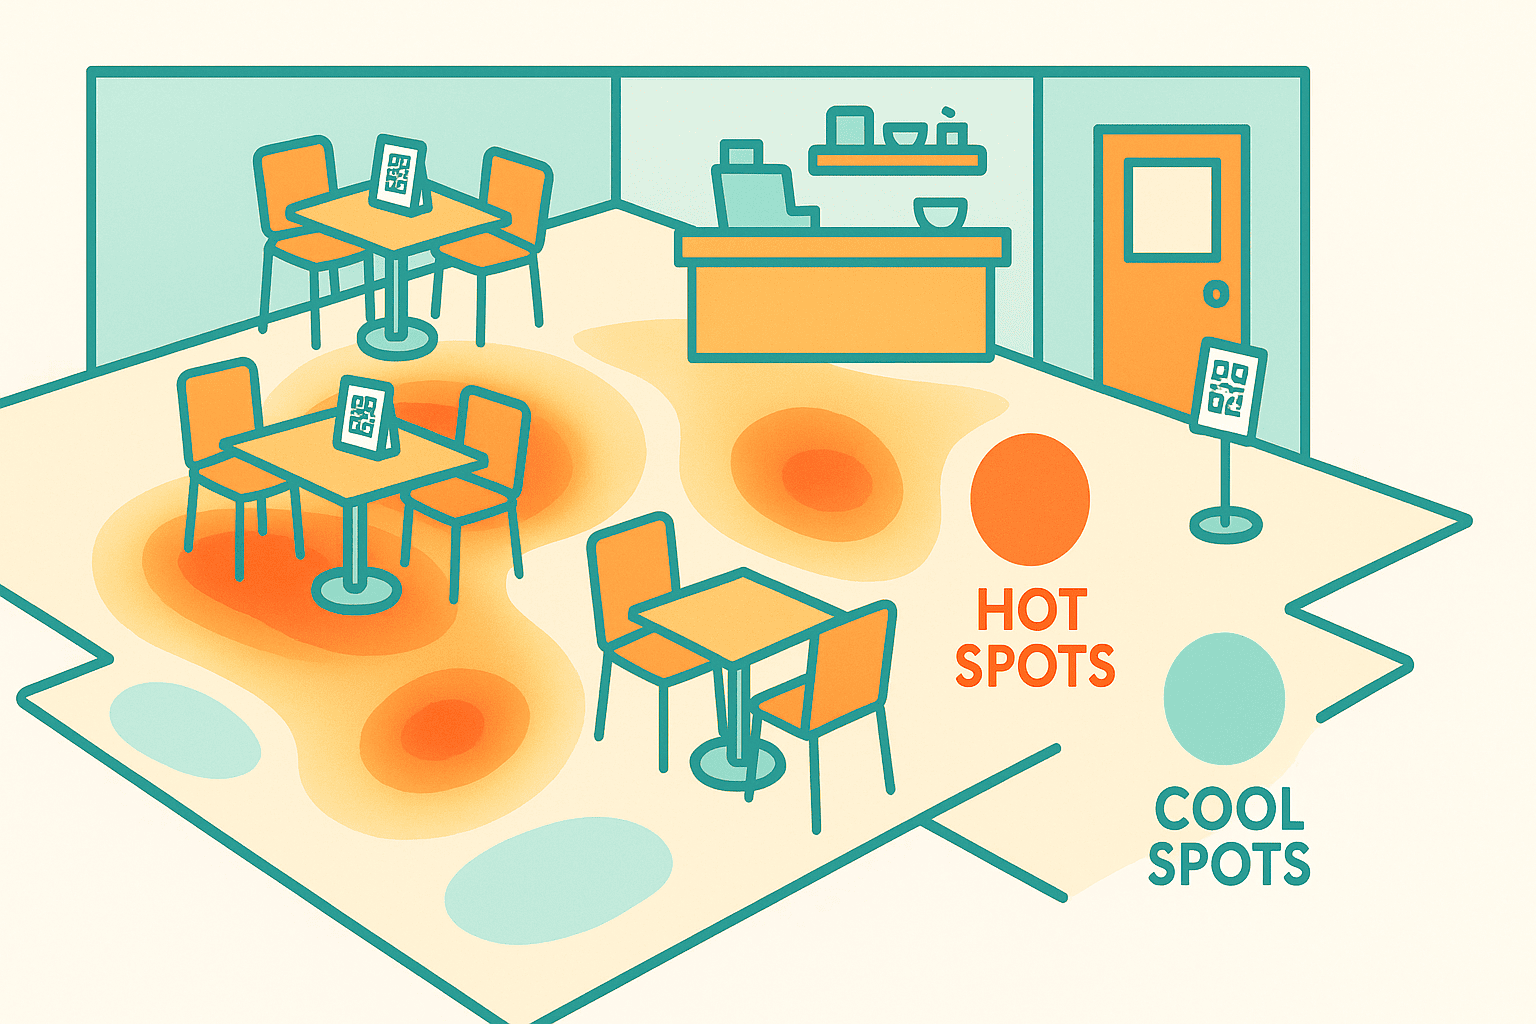
- Red and yellow: Indicate hotspots, or areas with the highest scan rates and engagement.
- Green and blue: Indicate coldspots, or areas with little to no interaction.
2. Strategic Uses of Heatmaps in F&B
QR Scanning Heatmaps can support more informed operational and marketing decisions across a restaurant.
2.1. Improving QR Code Placement
- Address coldspots: If Table 12 appears as a coldspot, investigate whether the QR code is obstructed or whether lighting is too bright or too dim. After making changes, continue monitoring the heatmap to see whether interaction improves.
- Build on hotspots: If the bar counter is a hotspot, it may be a suitable place to test new calls to action, exclusive offers, or flash sales.
2.2. Allocating Staff More Effectively
Heatmaps show not only scan counts but also when scans occur. For example, if activity shifts from the outdoor area at 3:00 PM, due to sunlight, to the indoor area at 6:00 PM, managers can reassign servers, bartenders, or customer consultants to the busier areas in real time. This can help optimize labor costs and speed up service.
2.3. Optimizing the Space
When a large area consistently appears as a coldspot—for example, a waiting area at the end of the lobby—the restaurant may consider putting that space to better use:
- Transform the area: Use it for local product displays, such as souvenirs, or create an interactive check-in spot.
- Add engagement opportunities: Place marketing materials there, such as LED signs or digital screens displaying the QR code menu.
3. Connecting Heatmaps to Conversion Data
QR Scanning Heatmaps become more valuable when they are connected to actual conversion data.
3.1. Reviewing Sales Performance by Area
Heatmap layers can show not only scan volume but also the conversion rate to actual orders in each area.
- High scans, low revenue: If Table 10 receives many scans but generates low sales, possible causes may include a menu that does not appeal to that customer segment, limited upselling skills among staff in that area, or a broken QR code landing page.
- High-conversion hotspots: If Table 5 has both a high scan rate and strong sales, the area can be replicated by creating more tables with similar characteristics or used as a test area for new menus and calls to action.
3.2. Measuring Physical Marketing Campaigns
When introducing a new campaign—for example, a standee promoting a new drink—the heatmap can show whether a new scanning hotspot appears around the standee. This offers a direct way to assess the performance of physical marketing materials.
3.3. Improving the Customer Experience
Heatmap analysis can also reveal customer habits. If the waiting area has a high scan rate but short dwell times, for instance, the QR code menu may be too long or difficult to navigate. One option is to create a dedicated QR code for the waiting area that displays only entertainment options or a Quick Drinks Menu.
4. QR Heatmaps as a Digital Tool for Space Management
A QR Scanning Heatmap connects physical spaces with business data, helping F&B managers make decisions based on measurable activity rather than intuition or casual observation.
By showing where customers actively engage, restaurants can refine their layout, place sales tools such as QR codes more effectively, and allocate resources where they are needed. Hotspots can be used more strategically, while coldspots can be reassessed for new opportunities.
Set up Dynamic QR Codes to analyze your sales floor layout and make more data-informed decisions at QRCode GEN.